
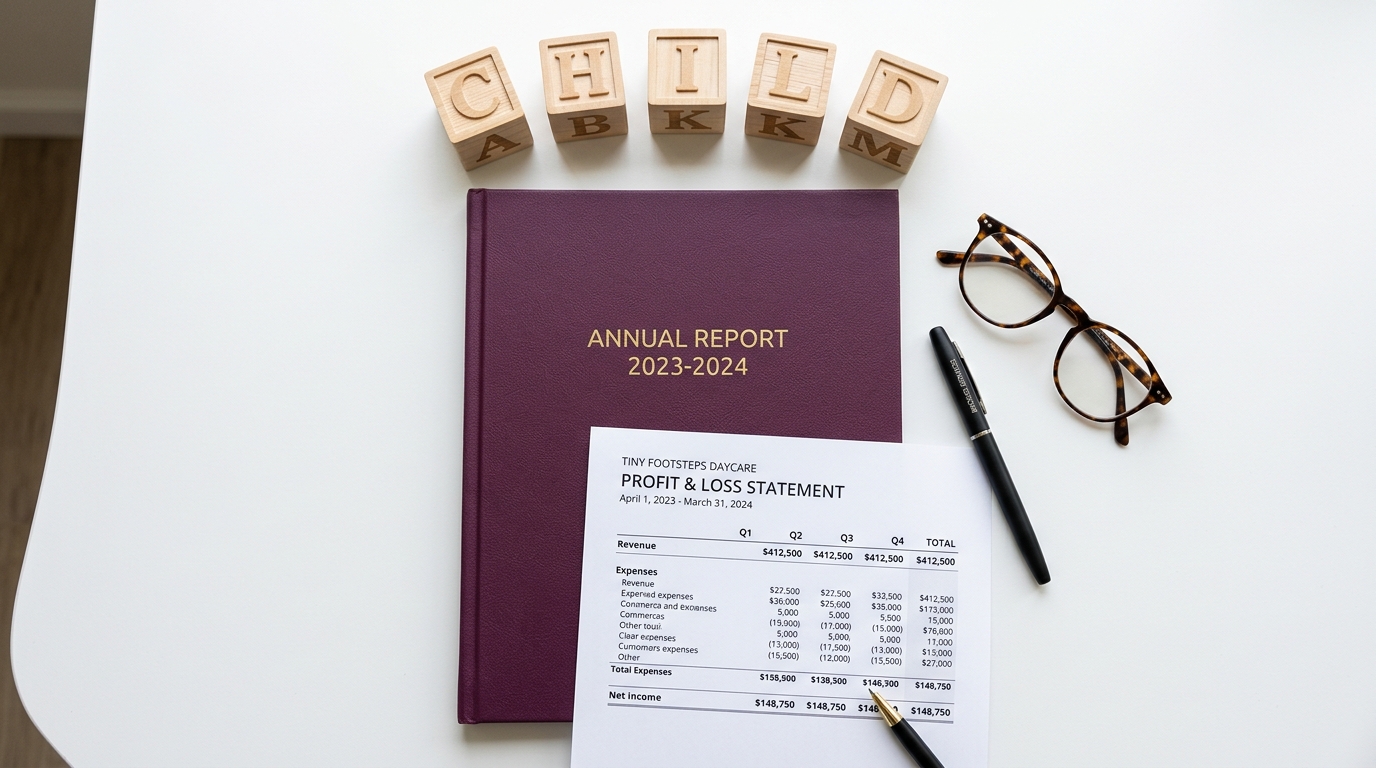
In a preschool sale, a single year’s financials tells a story. Three years of financials tells a trend. And buyers — and their lenders — care far more about trends than snapshots. Understanding how to read, present, and use your year-over-year data is one of the most practical ways to strengthen your position in any sale negotiation.
Why Trends Matter More Than Single-Year Numbers
The fundamental buyer question is: is this business getting stronger, holding steady, or declining? A single year’s P&L can’t answer that. A three-year trend can — and buyers and SBA lenders require at least three years of financial data precisely because they want to see the trajectory.
A school that earned $150,000 in SDE three years ago, $175,000 two years ago, and $200,000 last year tells a compelling story of consistent growth. A school that earned $200,000 three years ago and $150,000 last year tells a concerning story of decline — even though the most recent year’s number matches the first school’s starting point. The direction of the trend matters enormously.
The Most Important Year-over-Year Trends to Track
Revenue Trend
Consistent revenue growth — even modest 3–5% per year — signals pricing power, enrollment stability, and healthy demand. Buyers see consistent revenue growth as evidence that the business can continue growing under new ownership.
Example: $950,000 → $1,010,000 → $1,085,000 over three years. That’s 14% cumulative growth. Buyers see a business gaining momentum — and are more likely to pay a premium multiple to get in front of that growth curve.
Revenue decline, even from a high base, raises questions about competition, enrollment challenges, or pricing problems. If you have a legitimate explanation for a down year, document it and tell that story proactively.
SDE Trend
Normalized SDE should ideally grow alongside revenue — or at minimum maintain margin. A school where SDE is growing faster than revenue is improving margins. A school where revenue grows but SDE is flat or declining is facing rising costs — and buyers will probe why.
Enrollment Trend
Track your enrollment month by month across at least two years. Show buyers peak and trough enrollment, utilization rate trends, and how quickly you fill back up after seasonal dips. A school that starts September at 95% capacity after summer disruption shows strong family demand and effective re-enrollment practices.
Cost and Efficiency Trends
Labor costs as a percentage of revenue, rent as a percentage of revenue, food costs — these efficiency ratios tell buyers how well-managed the business is. Improving ratios over time signal operational maturity. Spiking costs need explanation.
Presenting a Three-Year Comparative Financial Summary
The sellers who attract the strongest offers present their financials in a three-year comparative format that makes the trend immediately visible. Here’s what a strong comparative summary might look like:
- Revenue: $920,000 → $975,000 → $1,040,000 (13% growth over 3 years)
- SDE: $155,000 → $172,000 → $196,000 (26% growth over 3 years)
- SDE Margin: 16.8% → 17.6% → 18.8% (improving margins)
- Enrollment (avg): 82 children → 88 children → 93 children
- Utilization Rate: 82% → 88% → 93%
This format immediately communicates a story of consistent, improving performance. A buyer looking at these numbers feels the momentum and is more motivated to compete for the school at a premium price.
When Trends Are Imperfect
Not every seller has three years of clean upward trends. COVID disruptions, enrollment gaps, personal health events, or facility challenges can create dips that need context. Tell the story proactively and factually — don’t hide the data, but frame it accurately.
A one-year dip with a clear external cause and a documented recovery trend is far less concerning to buyers than a one-year dip with no explanation. Buyers can handle imperfect history. What they can’t handle is uncertainty about why the numbers look the way they do.
What This Means for You
Start tracking your key metrics consistently now — monthly enrollment, monthly revenue, quarterly SDE estimates. The sellers with the most compelling trend stories are the ones who’ve been keeping records long enough to show a genuine trajectory. Don’t wait until you’re six months from listing to figure out what your trend looks like. Know it now, and if it’s not where you want it, you have time to change it before you sell.